
Page 38 - clra62_0019-(GIPE)
P. 38
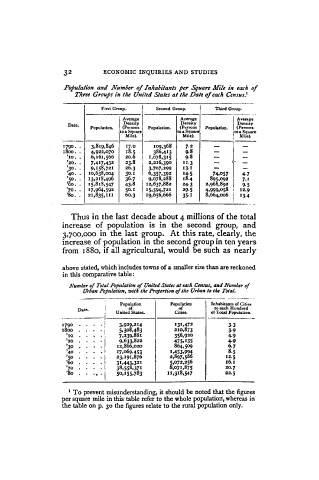
3 2        ECONOMIC  INQUIRIES  AND  STUDIES
                  Population  and  Number  of Inhabitants  per Square Mile  in  t(uh  of
                     Three  Groups in the  United States at the Date of each  Census.  1
                                       I
                            First Group.   Second  Group.   Third Group.
                                  Average  I      Average       I Average
                                  Density         Density       I Density
                   Date.
                         Population.   (Persons I  PopulaJion.   (Persons   Population.   (Penon.
                                 toa Square      to a Square    1'0 a Squa  re
                                   Mile).
                                                  Mile).
                                                                  Mile).
                  ---
                  1790·  .   3,819,846   17·0   1°9,3 68   7·2   -  -
                  1800 •.   4,922,070   18·5   386,4 1 3   9.8   -  -
                   '10 ..   6,161,566   20.6   1,078,315   9.8   -  -
                   '20 ..   7,417,432   I  23.8   2,216,390   11·3   -  -
                   '3°·  .   9,158,721   26·3   3,707,299   13. 1   -  -
                   '4°'  •   10,638,004   3°·1   6,357,392   14·5   74,057   4·7
                   'So ..  13,218,496   36.7   9,078,288   18·4   895,092   7·1
                   '60 •.  15,818,547   43.8   12,637,882   24·3   2.968.892   9·5
                   '70 .•  17,964,592   5°·1   15.594,721   29·5   4,999,°58  I  12·9
                   '80 ..  21,835,111   60·3   19,656,666   35. 1   8,664,006  I   13·4
                                                                I
                    Thus in the last decade about 4 millions of the total
                  increase  of  population  is  in  the  second  group,  and
                  3,700,000 in  the last group.  At this rate, clearly, the
                  increase of population in the second group in ten years
                  from  1880,  if all agricultural, would  be such  as  nearly
                  above stated, which includes towns of a smaller size than are reckoned
                  in this comparative table:
                    Numbe,. of Total Population of Unitea States at eod, Census. ana Numbe,. of
                       U,.ban Population. witk tke p,.oportion of tke U,.ban to Ike  Total.
                                 PopulaJion    Population   Inhabitants of Cities
                                    of
                                                           to each Hundred
                                                 of
                      Date.   I   United States.   Cities.   of Total Population.
                             I
                  -
                  179°      • i   3,929,214     131.472        3·3
                  1800      '1   5.308,483      210,873        3·9
                   '10           7.239,881      35 6 .9 20     4-9
                   '20           9,633,822      475,135        4·9
                   '3°           12,866,020     864,509        6·7
                   '40           17,069,4.S3   1.453,994       8·5
                   '50           23,191,876    2,897.586      12·5
                   '60           31,443,3 21   5,°72,25 6     16.1
                   '7°           38,558,37 1   8,071,875      20·7
                   '80    ' •. i   5°.155,7 8 3   11,318.547   22·5
                   1  To prevent misunderstanding, it should be noted that the figures
                  per square mile in this table refer to the whole population, whereas in
                  the table on p.  30 the figures relate to the rural population only.