
Page 377 - clra62_0019-(GIPE)
P. 377
.
WEALTH OF JMPIRE, AND HOW IT SHOULD BE USED 369
\
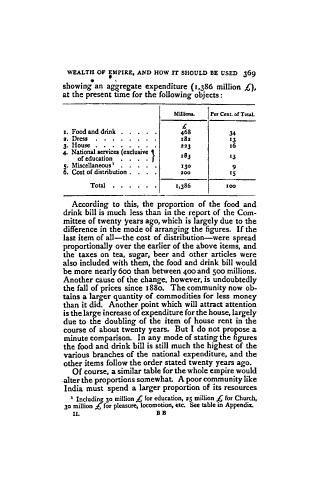
showing an aggregate expenditure (1,386 million £),
at the present time for the following objects:
Millions. Per Cent. of Total.
-
. £
I. Food and drink 468 34
:I. Dress . . 182 13
3. House . • . • . • . 223 16
4. National services (exclusive}
o( education • • • . 18 3 13
130
S. Miscellaneous 1 • • 9
6. Cost of distribution . 200 IS
Total . . . 1,386 100
According to this, the proportion of the food and
drink bill is much less than in the report of the Com-
mittee of twenty years ago, which is largely due to the
difference in the mode of arranging the figures. If the
last item of all-the cost of distribution-were spread
proportionally over the earlier of the above items, and
the taxes on tea, sugar, beer and other articles were
also included with them, the food and drink bill would
be more nearly 600 than between 400 and 500 millions.
Another cause of the change, however, is undoubtedly
the fall of prices since 1880. The community now ob-
tains a larger quantity of commodities for less money
than it did. Another point which will attract attention
is the large increase of expenditure for the house, largely
due to the doubling of the item of house rent in the
course of about twenty years. But I do not propose a
minute comparison. In any mode of stating the figures
the food and drink bill is still much the highest of the
various branches of the national expenditure, and the
other items follow the order stated twenty years ago.
Of course, a similar table for the whole empire would
.alter the proportions somewhat. A poor community like
India must spend a larger proportion of its resources
1 Includin.$ 30 million'£ for education, 2S million .£ (or Church,
3 0 million .£ for pleasure, locomotion, etc. See table in Appendix.
II. B B